Creating your own indicators
AmiBroker allows the user to define his/her own indicators written in flexible
AFL (AmiBroker Formula Language). You can find the description of this language
in AFL Reference Guide section of user's guide. Here I will present basic steps
needed to define and display your own custom indicator. In this example we will
define an "indicator" that will show line volume graph (opposite to
built-in bar volume graph).
Just follow these steps
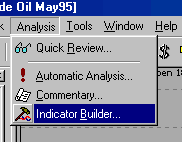
- Select Analysis->Indicator Builder option from the menu as shown
below:

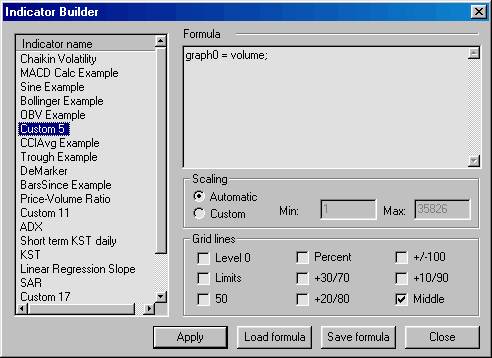
- You will see the following dialog displayed on the screen:

then select one of the indicators listed on the left side of the window. Selected
item will be highlighted.
- Single-click this item and it will change to the editable field as shown
below:

Now you can edit the name of the custom indicator. Give it the name "My
own indicator"
- Then click in the the formula field, delete existing text (if any) in the
box and type in the following formula:
graph0 = volume;
This formula instructs AmiBroker that graph number 0 should plot volume array.
- Select Scaling - Automatic and Grid lines: Middle as shown in the picture
above
- Click "Apply" and then "Close" Indicator Builder
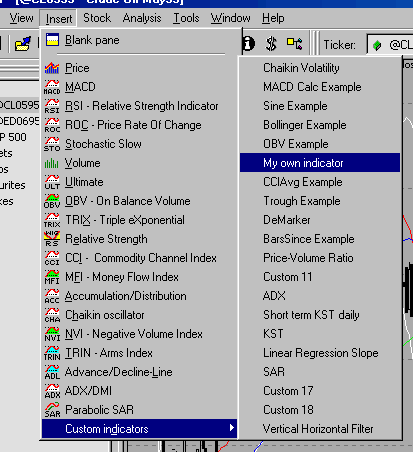
Now you are ready to use your first custom indicator - please select menu Insert->Custom
Indicators->My own indicator as shown in the picture below:

A new chart pane will be displayed showing volume line chart.
For further information on creating your indicators please check Using
graph styles and colors tutorial section
For further reference on using Indicator Builder please consult Environment
- Indicator Builder and AmiBroker Formula Language - AFL Tools sections
of AmiBroker User's guide and using AFL editor.


